


 Subvolts take Flint is a Microsoft visualization language simplifying AI chart creation and human editing. Jul 8, 2026
 - Developers
- Flint provides a more robust and human-editable way to generate visualizations using AI, reducing code fragility.
- Business
- Streamline data analysis and reporting by enabling AI to create clearer, more accurate, and easily modifiable charts.
This research introduces a new abstraction layer for AI-generated visualizations, making them more reliable and easier for humans to work with.
Flint: A visualization language for the AI era

By
Chenglong Wang
,
Senior Researcher
Alper Sarikaya
,
Senior Data Visualization Engineer
Scott Tsukamaki
,
Sr. Technical Program Manager
Michel Galley
,
Senior Principal Research Manager
Jianfeng Gao
,
Technical Fellow & Corporate Vice President Creating a good chart requires many design decisions: how dates should be parsed, whether a sca
Opening of the original on Microsoft Research Blog From Subvolts
Summary and analysis by Subvolts editorial, AI-assisted.
Microsoft Research introduces Flint, a new intermediate language for AI-driven chart creation. Flint simplifies the process by allowing AI agents to generate expressive charts from compact specifications. The Flint compiler infers complex design details from data and chart intent, freeing users from error-prone, low-level parameter management and enabling easier chart inspection and reuse.
Microsoft Research introduces Flint, a new intermediate language for AI-driven chart creation. Flint simplifies the process by allowing AI agents to generate expressive charts from compact specifications, freeing users from complex parameter management.
Flint addresses a key challenge in AI-assisted visualization: brittle, complex code generated by agents. By creating an intermediate language, Microsoft enables AI to produce more reliable and human-editable chart specifications. This benefits developers and researchers by streamlining chart creation and improving collaboration. Unlike direct generation of backend code, Flint offers a more robust abstraction, potentially improving the quality and maintainability of AI-generated visualizations across different platforms.
- Product Name: Flint
- Company: Microsoft Research
- Type: Visualization intermediate language
- Supported Backends: Vega-Lite, Apache ECharts, Chart.js
- Encoding
- In visualization, mapping data attributes to visual properties like position, color, or size.
- Connecting data values to visual elements like position or color on a chart.
- Backend
- In software, the part of a system that performs the core processing or rendering, often interacting directly with hardware or specific libraries.
- The part of a system that does the actual work, like drawing the chart.




The Playbook: reusable how-tos, prompts, configs and tips pulled out of the news. From the Playbook, matched to the product and topics of this item.
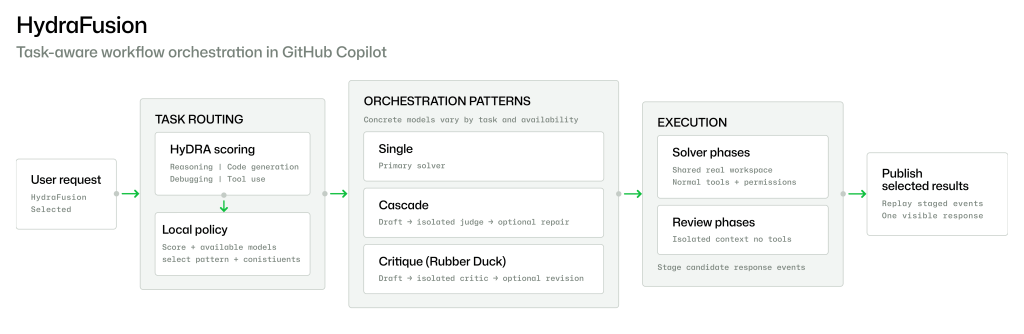
- HeuristicSelectivity is key to multi-model orchestrationChoose the least complex workflow that meets quality needs, using more powerful models only when necessary. · 5 min
- Model pickHydraFusion selects best model for taskHydraFusion dynamically chooses the most suitable model or model combination for each specific coding task. · 5 min
- ToolProject HydraFusion for GitHub CopilotOrchestrates multiple AI models to draft, critique, and revise code for optimal quality and cost. · 5 min
- Setting tipAccess HydraFusion via GitHub Copilot CLIUse /experimental in GitHub Copilot CLI to select HydraFusion as a model. · 1 min
Questions people ask
- What problem does Flint solve?
- Flint solves the problem of AI agents generating verbose, fragile, and error-prone code for charts. It provides a compact specification that is easier for both AI and humans to manage.
- How does Flint improve chart creation?
- Flint's compiler infers design details like scales, axes, and colors from high-level specifications, freeing users from manually setting complex, low-level parameters.
- Can Flint generate charts for different platforms?
- Yes, the same Flint specification can render through multiple backends, including Vega-Lite, Apache ECharts, and Chart.js.
More from Microsoft Research Blog 15 more




Page generated Oct 19, 2026. Summaries are Subvolts' own; the story belongs to Microsoft Research Blog.